


Scott Aquilino
Duration: 4 Sprints
Context & Problem
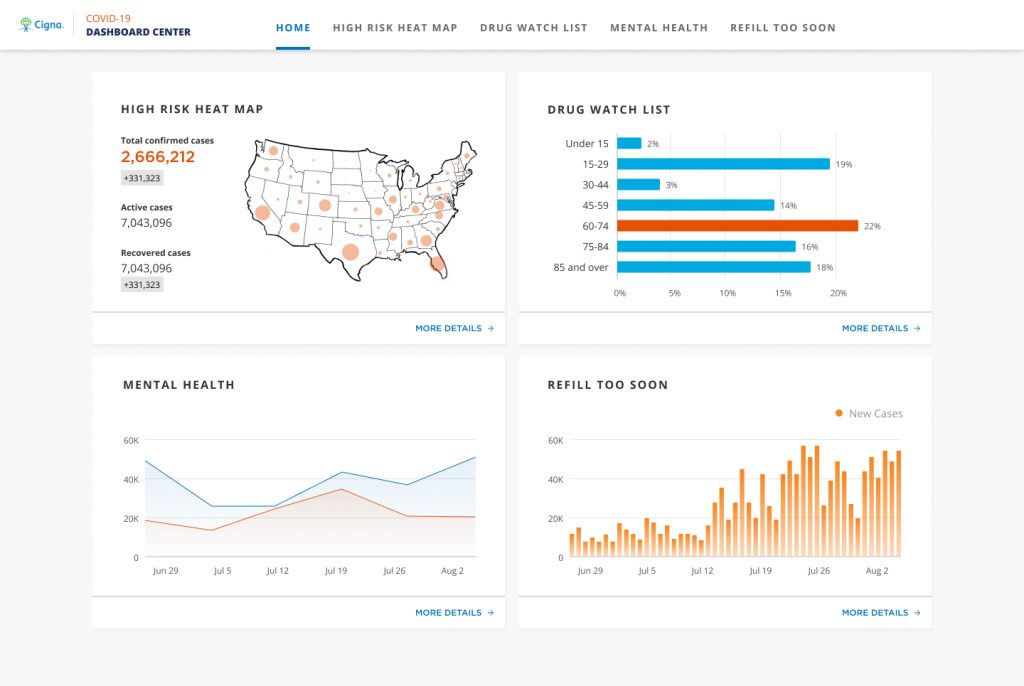
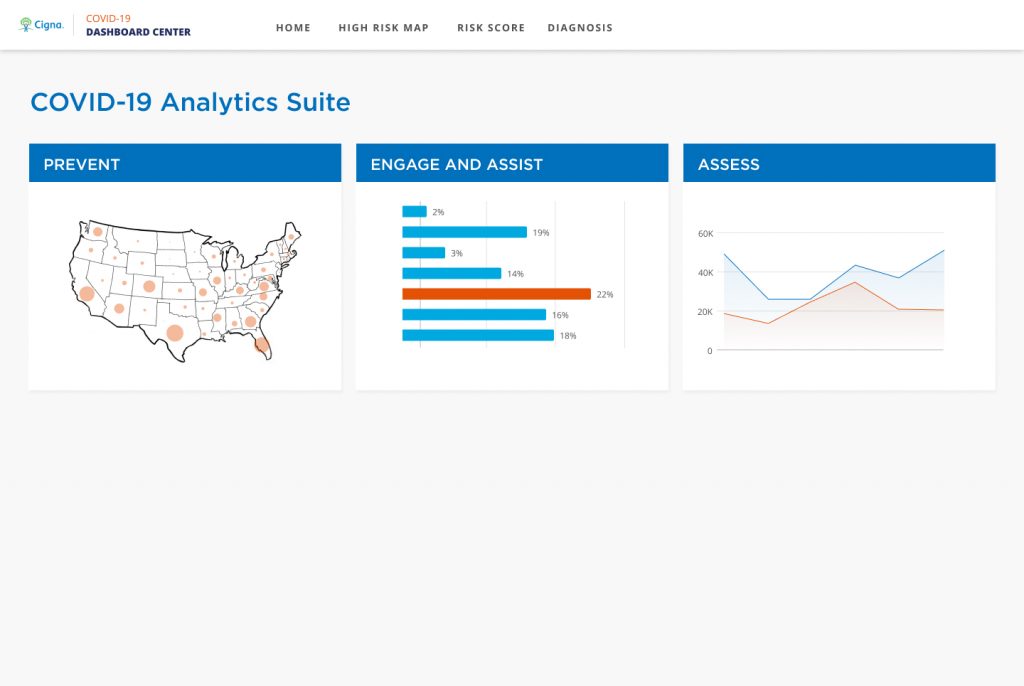
During the COVID-19 quarantine, there was an opportunity to guide large employer groups on returning to worksites, managing symptoms, and anticipating future outbreaks. As Senior Product Designer, I defined the strategy for the COVID Analytics Suite, designing a unified dashboard that consolidated fragmented tools and surfaced actionable insights, empowering client managers to make faster, data-driven decisions.
Key questions we aimed to answer:
- Who is at risk based on location and demographics?
- How can businesses safely re-open?
- How do we manage symptoms and reduce hospitalizations?
- What can we learn post-crisis?
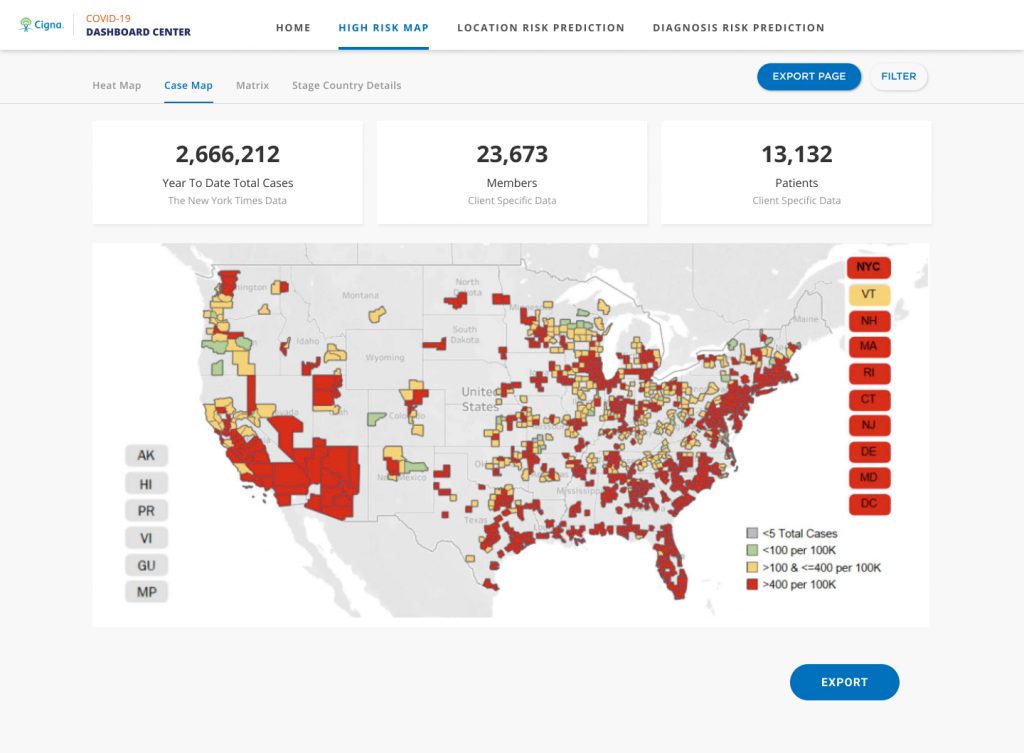
- What early warning signs can prevent outbreaks?
Opportunity
- Consolidating these tools into a single dashboard would give client managers actionable insights faster, enabling data-driven decisions to protect employees, reduce hospitalizations, and plan for future outbreaks.
Process
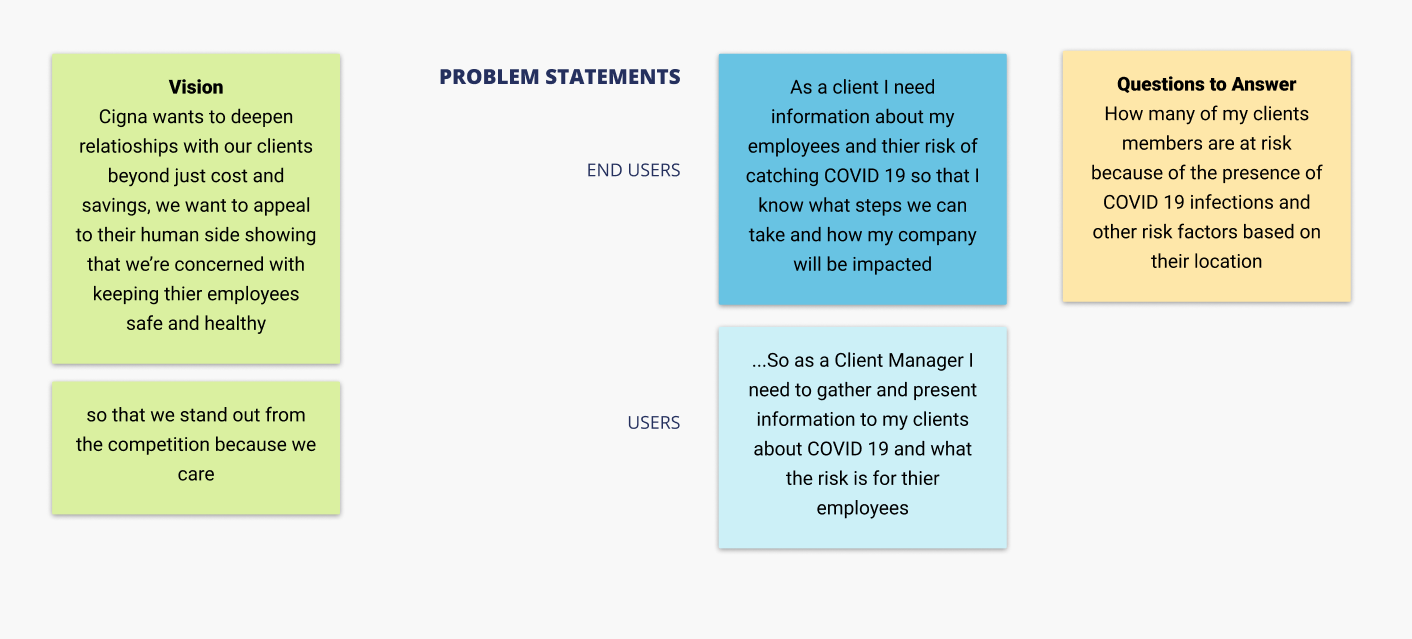
Questions-to-be-Answered Workshops
We aligned stakeholders around what the dashboard should help users answer.
- Facilitated workshops with business stakeholders and data experts.
- Used screenshots and existing dashboards as visual references.
- Defined the key user questions that the consolidated tool should address.
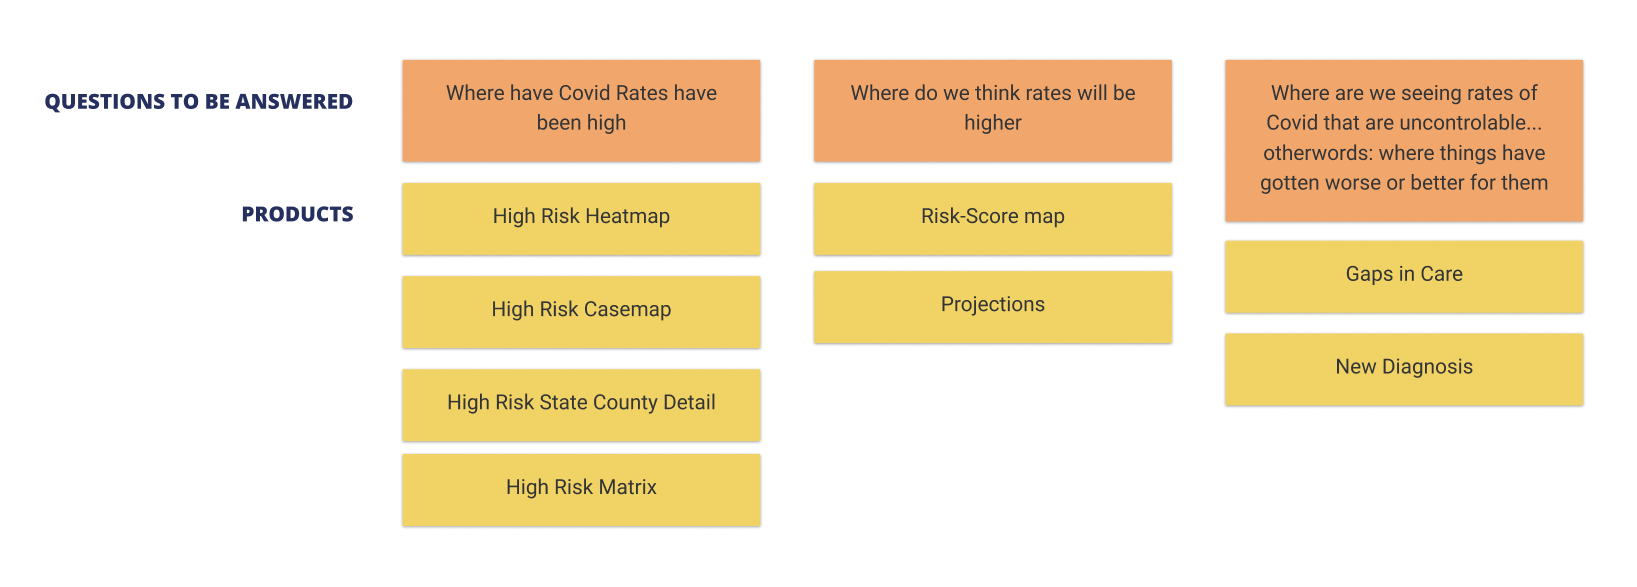
Auditing Existing Products
Based on these questions we audited tools that were already in production and looked for opportunities to leverage existing work.
- Held sessions with developers and product owners from each tool.
- Documented current features, workflows, and gaps.
- Identified opportunities to “lift and shift” components to streamline design.
Sitemap & Information Architecture
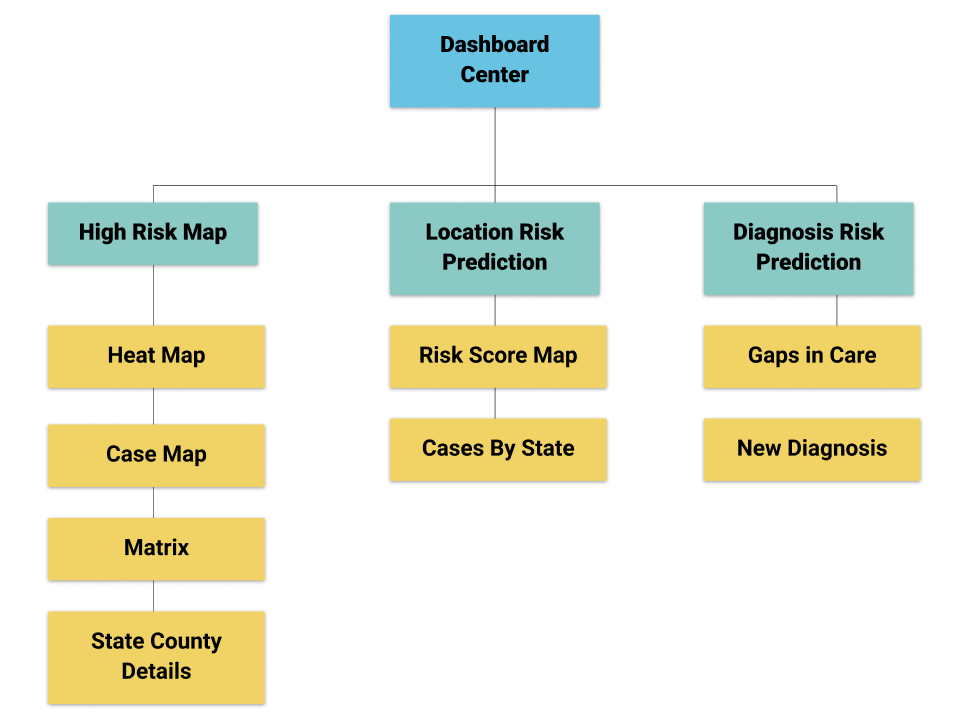
We explored how to organize content for maximum clarity and discoverability.
- Conducted usability testing with client managers, alongside workshops with stakeholders and subject matter experts.
- Structured content around user questions rather than tool features.
- Iterated sitemap to ensure data was easy to navigate and mirrored user workflows.
Design & Wireframes
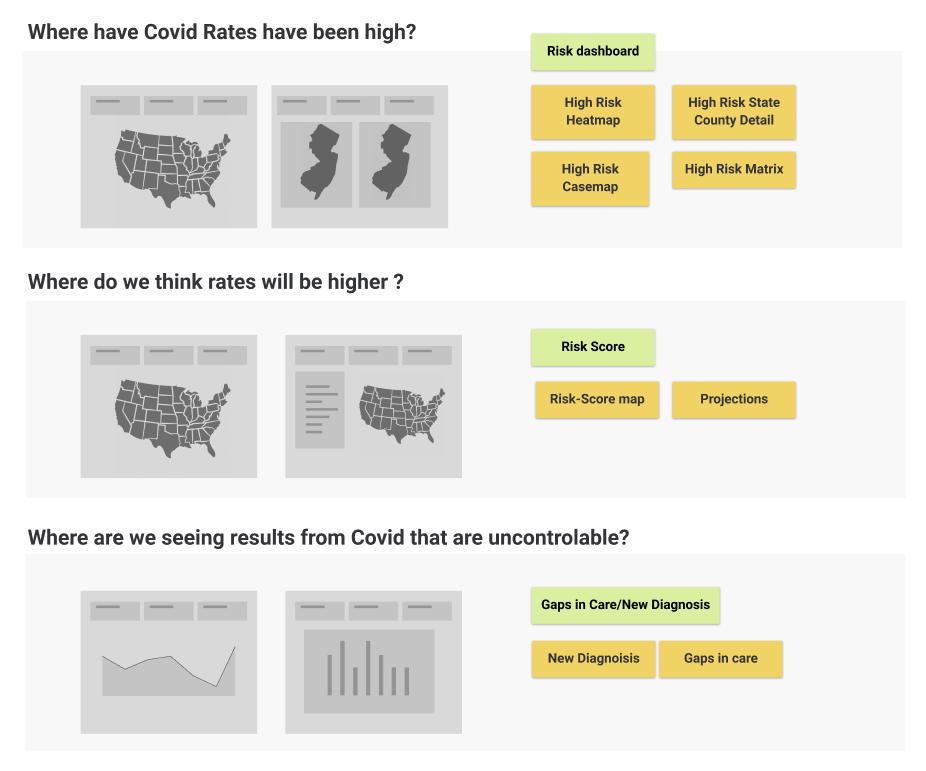
We translated the IA into wireframes and interactive prototypes.
- Led a team of four designers, assigning work on layouts, navigation, and micro-interactions.
- Conducted design review sessions with stakeholders and subject matter experts.
- Incorporated feedback to refine prototypes for usability and storytelling.
Data Visualization Innovation
We explored ways to make complex COVID-19 trends clear and actionable.
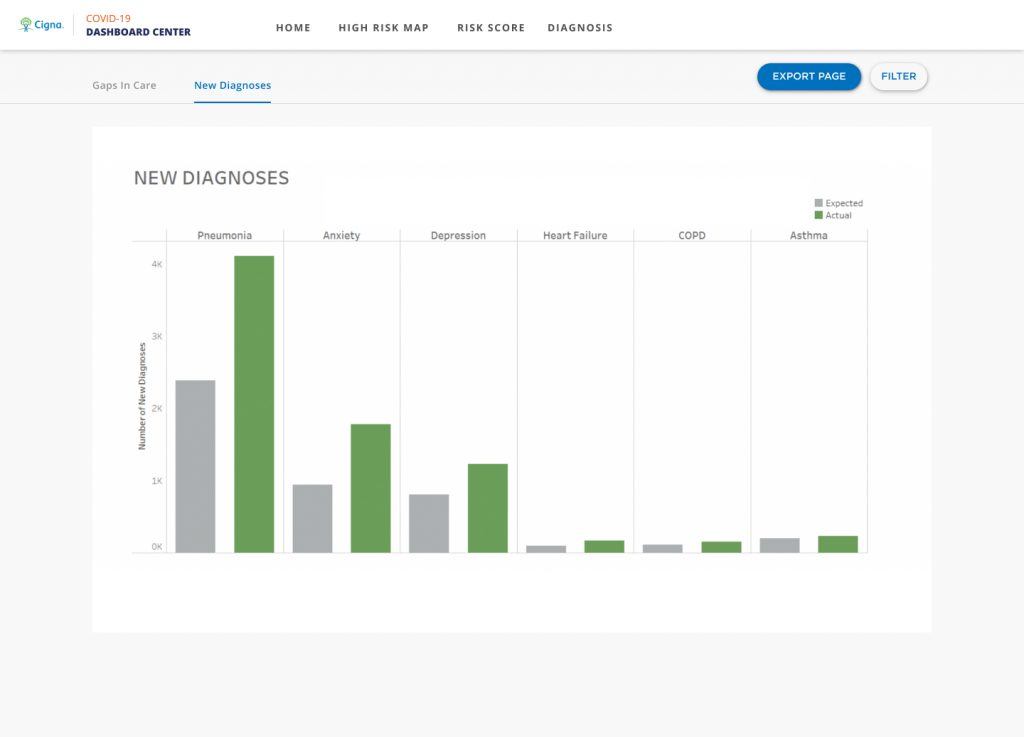
- Proposed a summary page for clinical diagnosis tracking and population insights.
- Chose trend line comparisons (2019 vs 2020) instead of control charts for clarity.
- Designed visualizations to facilitate client discussions about costs and care.
Results
We delivered wireframes and prototypes that could be used both for client-facing tools and a promotional video.
- Provided assets and guidance to the video production team on branding and animations.
- Positioned client managers to explore trends, communicate insights, and make decisions more effectively.
- Established a foundation for future testing and refinement with actual users.
The COVID Analytics Suite gave client managers a clear, actionable view of population health risks, enabling faster and more informed decisions during the pandemic.
- Early risk detection: Increase in at-risk populations flagged before outbreaks, allowing proactive interventions.
- Faster decision-making: Client managers reduced time to recommend workplace policies.
- Actionable outcomes: 78% of clients implemented new health or workplace policies based on dashboard insights.